


How the Public Sector Massages Diversity Data
"Our diverse mix of ethnicities reflects our role and the communities we support"

Workforce Data - Ethnicity in the Public Service
Several years ago, I was working for an organisation in the public sector and was responsible for commissioning information for its Annual Report, including its ethnic diversity. When the HR Adviser sent through the information, I was surprised. At first glance, the organisation seemed much more diverse than I had realised. Looking closer, however, I saw that he had been having a bit of fun with the data. The ‘European’ category had been split into three: ‘NZ European’, ‘European’ and ‘British’ and he intended to report each separately in the Annual Report.
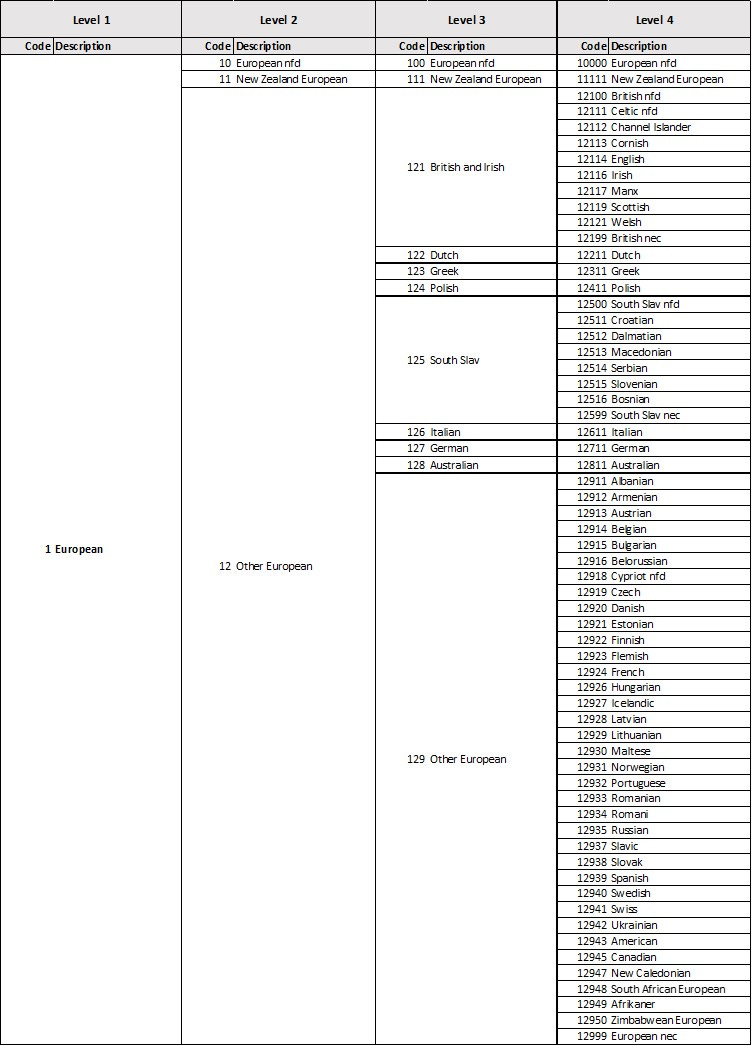
The data was compiled as a part of Papa Pounamu through which the Public Service Commission (PSC) has committed to “bring together diversity and inclusion practices and initiatives across the public sector.” The PSC amalgamates the diversity information of organisations using the Stats NZ Ethnicity Standard. Under this standard, each of these categories provided by my colleague would still be recorded as ‘European’ in the PSC’s Workforce Data. Despite this, organisations still have levers available to them to make themselves look more diverse than they really are.
The PSC is not Stats NZ and cannot apply the same rigour to its data. It is very reliant on the information it receives from across the sector. For example, the 2021 Public Service Census, Te Taunaki had a response rate of 63.1% (i.e. it wasn’t really a census). Moreover, the Workforce Data on Diversity and Inclusion that PSC reports annually (most recently on 10 October) is based on HR records. What this means is that there is plenty of scope for those working in HR to present a sanitised version of their workforce. At the end of the day and despite any audit requirements, the primary purpose of an Annual Report is to serve as a PR document for an organisation.
What levers do organisations have to make themselves look more diverse than they really are?


After looking through the most recent Annual Reports provided by various public sector organisations, it seems that there are four main ways that organisations can massage their diversity statistics.
Firstly, as I mentioned up-top organisations may split hairs between different types of white people. Looking at the examples above, DIA, Ministry for Ethnic Communities, Ministry of Transport and the Police split up ‘NZ European’ and ‘European’ into different categories. Anyone who has ever worked in a Wellington policy shop will be unsurprised given how frequently organisations hire more poms than Māori or Pasifika staff.
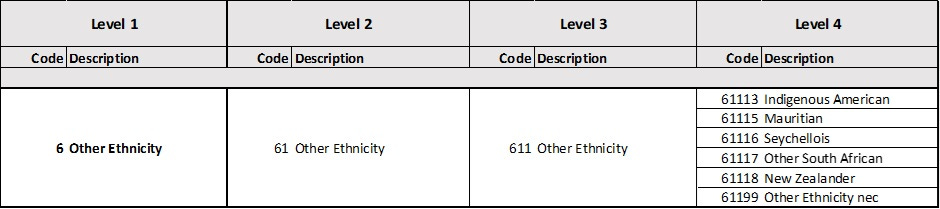
Secondly, there is the category of ‘Other Ethnicity’ which is intended to capture groups that have statistically small populations in New Zealand (e.g. Indigenous Americans) but which has become in practice the refuge of the scoundrel. A white person who self-identifies as ethnically ‘New Zealander’ (i.e. the most annoying person you know) will be included in this category. Note that the GCSB hires a significant proportion of staff whose ethnicity was ‘New Zealander’ until 2022/23 and are now recorded as ‘Other’. I also suspect that MBIE does not employ 8.1% Native Americans and this group includes a significant amount of Pākehā. This category is particularly egregious because when PSC reports the data, they will be defined as ‘Other’ (6.7% of the public sector in 2024) rather than ‘European’ (62.2% in 2024)
Thirdly, organisations can limit which groups of staff they report on. For example, data reported by DIA and the Ministry for Ethnic Communities excludes graduates and it is likely that most examples exclude contractors and consultants. I’m unsure whether this is statistically significant but these are all people who do government work, regardless of their employment status, so it definitely skews the data.
Finally, there is the fact that a lot of organisations just don’t have sufficient data. Many of the organisations above have statistically significant groups of people who have not provided ethnicity data or who are limited in the amount of data they can provide. When my aforementioned colleague was setting up HR software, it was up to me to explain that people could have more than one ethnicity and it was probably not appropriate to use the term ‘sub-ethnicity’. Different organisations are going to have different levels of sophistication in terms of policies and IT infrastructure which will impact the kind of data they collect and how widely it is socialised in their organisations.
Why does this matter?
The purpose, principles and ‘spirit of service’ of the Public Service are outlined in the Public Service Act 2020. The idea that any of these can be fulfilled by organisations comprising people who have little in common with the communities they serve is optimistic, to say the least.
The sector is already overwhelmingly white on its own terms but if you apply an appropriate level of scrutiny to data provided by these organisations, it is likely even more so. If you filter PSC’s data to specify ‘Policy Analyst’ you find that in 2024, 76% were European (and 7.1% were ‘Other’ which will likely include a lot of temporarily embarrassed Europeans). None of this will come as a surprise to people who work in these places but it demonstrates how laughable it is when organisations claim that “Our diverse mix of ethnicities reflects our role and the communities we support”
It’s also notable that the PSC’s data does not demonstrate a statistically significant improvement in diversity over time. With the Government hellbent on getting more bums on seats (regardless of the evidence-base), the sector is increasingly going to comprise people who can afford to live in Central Wellington. This will take a while to play out and I’m sure the unions will push back but it’s already having a cooling effect. Ministries advertising roles are quietly removing mentions of flexible working on the jobs they post and increasingly limiting their search to those who are Wellington-based. I expect we will see increasing levels of creativity in annual reports to hide this fact.
In case you missed it…
Last week I finished my self-inflicted viewing assignment for 31 Days of Horror.
I know not all of you are subscribed for my film takes, but you may be interested in my pieces on The Dead and the Deadly, Ugetsu and Tarantula.
 – The EOFFTV Review")